At the end of last month, the 292 tons of razor wire ordered by an Iranian customer arrived at the designated port of the customer. The customer has completed the collection and is very satisfied with the quality of our products after using them. Let us review the cooperation process below.

Razor wire packaging

Galvanized Razor Wire Mesh Roll

Razor barbed wire of qualified quality
Customer Background
The client is a security engineering company designated by the Iranian government, responsible for the security reinforcement project on the country’s western border. As the region has long faced problems with illegal border crossing and smuggling, the client required a high-strength, corrosion-resistant, and deterrent protective facility. After multiple comparisons, the client finally chose to import galvanized razor blade barbed wire from China. After comparing prices and services, the client chose to sign a contract with us.
Order details
1. Product name: Galvanized razor wire (BTO-22 type)
2. Material: High-strength low-carbon steel Q195
3. Surface treatment: Galvanized
4. Coating: ≥60g/m²
5. Blade spacing: 15cm, standard anti-climbing design
6. Coil length: 50 meters per roll, a total of 292 tons
7. Delivery time: 25 days (production + sea transportation)
8. Transportation method: Sea transportation, Qingdao Port → Bandar Abbas Port
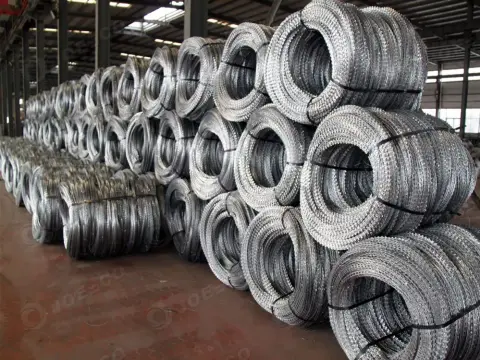
Wanzhi Steel full size razor wire in stock
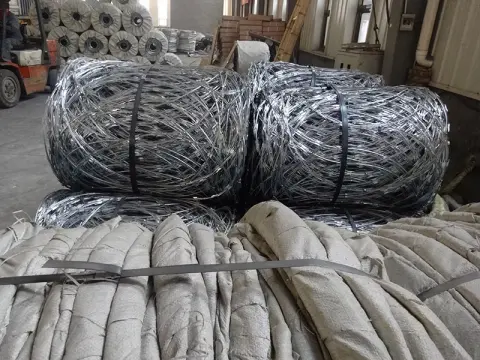
Bto-16 Galvanized Razor Barbed Wire
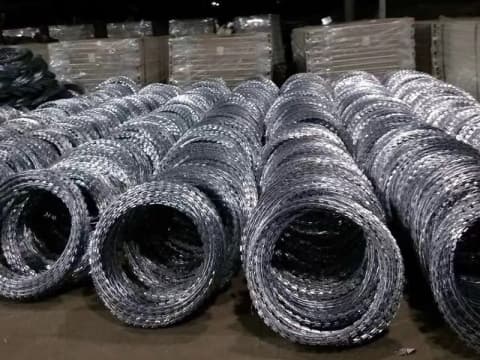
High Quality Razor Wire Wholesale
Production process
(1) Raw material preparation: Q195 low-carbon steel wire is used, cold-rolled and drawn to a diameter of 2.5mm to ensure toughness and strength.
(2) Blade stamping: The steel wire is pressed into a sharp blade (BTO-22 type, double-edged design) through a precision mold.
(3) Hot-dip galvanizing: Both the blade and the wire are immersed in 450°C zinc liquid to form a uniform coating to prevent rust and extend the service life.
(4) Spiral assembly: The blade and the core wire are automatically wound into a spiral circle, and the spacing is strictly controlled at 15±2cm.

Razor wire automatic machine

Production line

Razor barbed wire assembly install the blade
Quality Check
1. Coating inspection: zinc coating thickness gauge ensures ≥60g/m², in line with ASTM A123 standard.
2. Tensile test: tensile strength ≥500N/mm², blade does not fall off.
3. Appearance inspection: no missing plating, burrs, blade angle 45°±5° to optimize puncture effect.
Packaging and transportation
1. Rust-proof packaging: Each roll is wrapped with moisture-proof paper and PVC woven bag.
2. Container loading: 40HQ container can hold 400 rolls (to avoid squeezing and deformation).
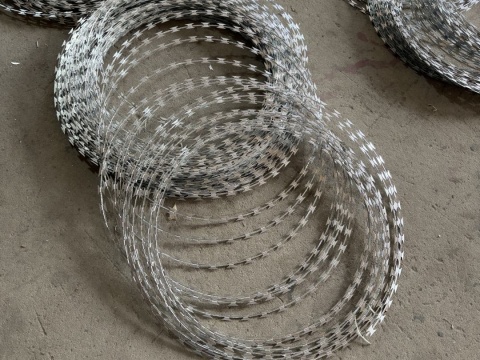
Hot Dip Galvanized Razor Wire Manufacturer
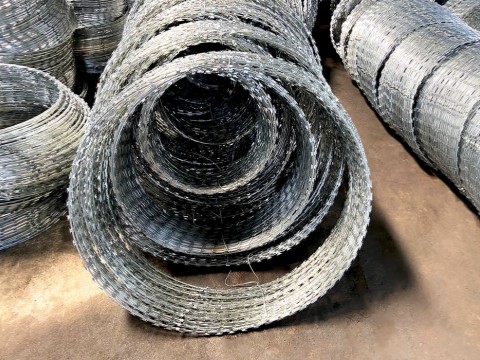
concertina razor wire coils
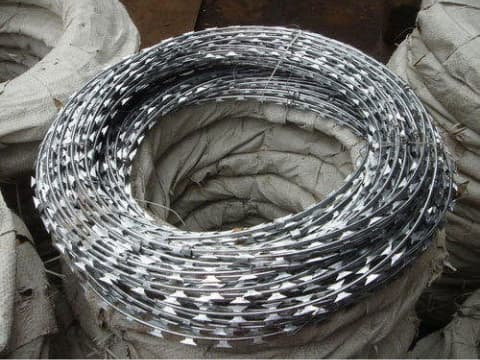
concertina razor barbed wire package
Why choose razor wire?
1. High deterrence: The sharp blade structure directly transmits the “no entry” signal, and the psychological deterrence effect is far superior to ordinary fences.
2. Strong physical protection: The blades are densely spaced, making climbing or cutting extremely difficult, and even using tools requires a long time to operate.
3. Strong weather resistance: Galvanized or stainless steel materials can resist corrosion, UV rays, and adapt to extreme climates, and adapt to Iran’s hot, dry and dusty environment.
4. Flexible installation: It can be used alone or quickly deployed on top of a wall or fence to form a multi-level protection system.
5. High cost-effectiveness: Compared with concrete walls or electric fences, it has low maintenance costs and a lifespan of more than 10 years.

Concertina wire effect

Flat Razor Wire

Welded Razor Wire Fence Panels
Application of razor wire
Razor wire is a kind of sharp blade-shaped barbed wire stamped from high-strength galvanized steel plate or stainless steel plate, combined with high-tension steel wire or iron wire to fix the protective net. Due to its unique structure and strong deterrent power, it is widely used in scenes requiring high security protection.
1. Border & port protection: As a physical barrier at national borders, military bases, radar stations, and customs ports, it effectively prevents illegal intrusion.
2. Prisons & detention centers: Used on the top of the wall or perimeter fence to prevent prisoners from climbing and escaping, and use the sharp characteristics of the blade to prevent jailbreak.
3. Field defense: In temporary fortifications and anti-terrorism drills, razor wire can be quickly deployed to form a physical barrier and delay enemy actions.
4. Military & confidential areas: Set up around military bases, ammunition depots, substations, water plants, oil depots, etc., to prevent man-made damage or theft.
5. Roads, airports, and ports: Installed at bridges, tunnel entrances, along railways, and airport perimeters to prevent people from climbing or throwing objects to interfere.
6. Farms & ranches: prevent wildlife from invading or livestock from escaping, while reducing the risk of theft.

GI concertina wire

For military use

Border security
Typical cases
1. Israel border wall: Combining razor wire and electronic monitoring to form the most stringent border defense system in the Middle East.
2. U.S. federal prison: Use multi-layer razor wire + high-voltage power grid to achieve a “zero escape” record.
3. Brazilian slum control: Police deploy razor wire in conflict areas to quickly isolate dangerous areas.
Final Words
Razor wire has become an indispensable physical barrier in modern security protection with its “low cost and high efficiency” characteristics. It can be directly superimposed on the existing fence, no professional personnel are required, and the operation is very simple. It will not rust for 10-15 years.
Wanzhi Steel adopts customized production and supports different blade models (BTO-10/BTO-22/BTO-30) and coating requirements. We provide installation guidance and after-sales maintenance solutions.
Consult Now:
Official website: https://wanzhifence.com
Email: info03@wanzhisteel.com
Our WhatsApp: 8613938459717
Leave Us A Message


